
What Is BMI — What It Tells You, What It Doesn't, and When to Ignore It
BMI is one of the most used and most misunderstood health metrics in the world. Here's the complete picture on what it measures, where it falls short, and what to track instead.
Two people walk into the same clinic. Both stand 5 foot 10. Both weigh 188 pounds. Both get the same BMI: 27.0, stamped "overweight." One is a competitive rower with visible abs and a resting heart rate of 48. The other hasn't trained since high school and carries most of his weight around the middle. BMI cannot tell them apart. That single fact explains almost everything worth knowing about what BMI is, what it quietly throws away, and when the number on your chart deserves to be ignored.
So let's answer the real question. BMI, or Body Mass Index, is a number that describes a crowd, not a person. It was built to sort populations quickly and cheaply, and it does that job well. The trouble starts the moment a single human being tries to read their own health off it. We'll show you exactly where the line is, using numbers you can reproduce yourself in about thirty seconds.
Same BMI, Four Different Bodies
Here is the demonstration that no BMI chart will ever print. Below are four people. Every one of them lands at a BMI of roughly 27.0, which the World Health Organization classifies as "overweight." We calculated each BMI directly from height and weight, then paired it with the body fat percentage and waist-to-height ratio you'd actually find if you measured them. Read across each row and watch the story change.
| Person | Height / Weight | BMI | Body fat | What's really going on |
|---|---|---|---|---|
| Rower, 28 | 5'10" / 188 lb | 27.0 | 11% | Lean and athletic. The "overweight" label is simply wrong. |
| Office worker, 34 | 5'4" / 157 lb | 26.9 | 38% | Genuinely elevated risk. BMI happens to be right here. |
| New parent, 41 | 5'8" / 177 lb | 26.9 | 24% | Middle of the road. The number poses a question, not a verdict. |
| Retiree, 71 | 5'6" / 167 lb | 27.0 | 33% | Muscle loss with age hides real risk behind a "borderline" score. |
Four identical scores. One healthy athlete, two people with quietly serious risk, and one in the genuine middle. BMI assigned all four the same label and was useful for exactly one of them. Run your own height and weight through the BMI calculator with the built-in AI assistant and you'll get your number in seconds. The harder and more important work is figuring out which of these four rows you actually resemble. That single question, which row are you, is the one BMI can never answer on its own, and it's the question the rest of this article is built to help you solve.
What BMI Measures, and the Information It Deletes
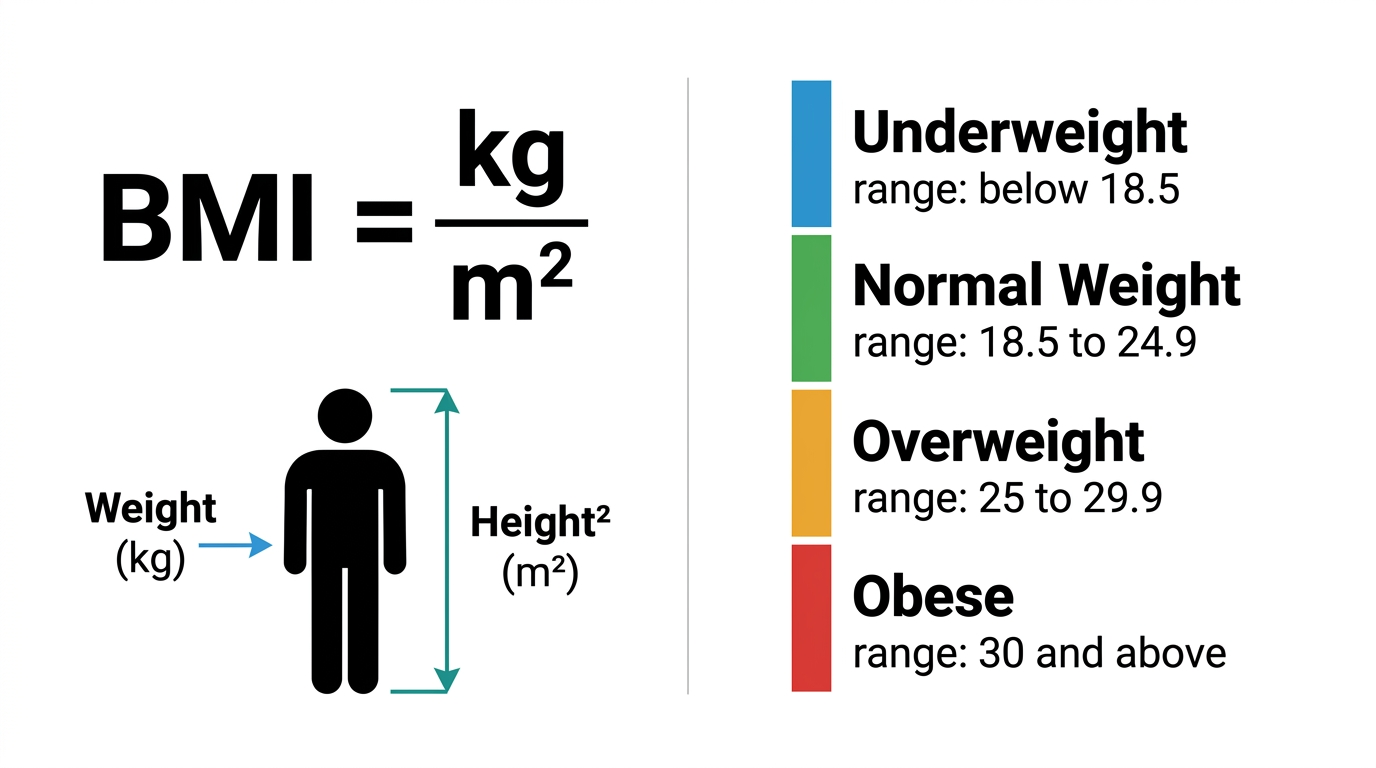
The formula is simple. Divide your weight in kilograms by the square of your height in meters. In US units, multiply your weight in pounds by 703, then divide by your height in inches squared. That's it. BMI = mass relative to height, expressed as one tidy number.
Think of BMI as a compression algorithm for your body. It takes everything about you, your muscle, your fat, where that fat sits, your bone density, your age, your sex, and crushes all of it down into a single digit pair. Compression is powerful because it's fast. It's also lossy. Once your body is squeezed into "27," the information that actually predicts disease, namely how much of you is fat and where that fat lives, has already been thrown away.
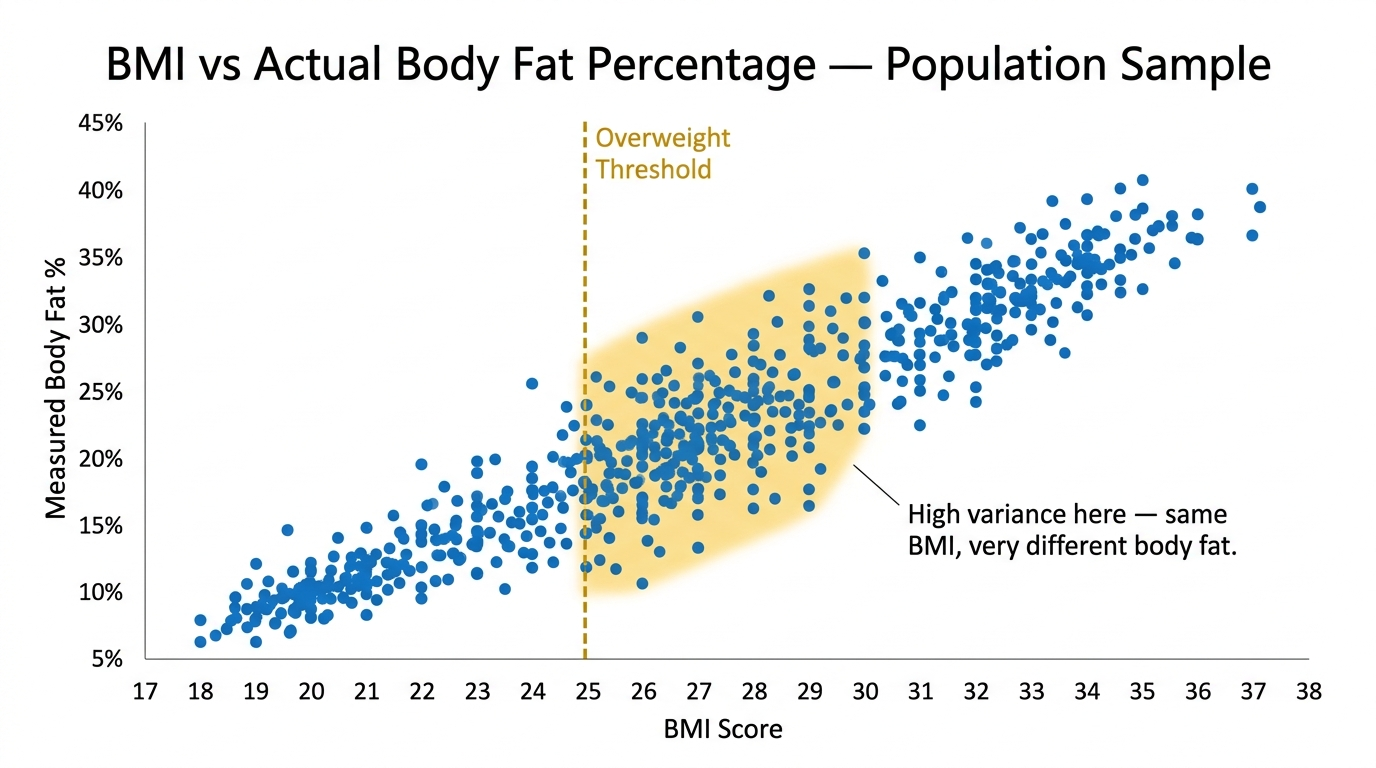
This is why two people at the same BMI can sit on opposite ends of the health spectrum. The number isn't lying. It's just answering a much narrower question than most people think it's answering. BMI tells you how heavy you are for your height. It does not tell you how healthy you are, and those are not the same thing.
The compression metaphor goes further than it first appears. When you compress a photo too hard, you don't just lose detail, you introduce errors that weren't in the original. BMI does the same. By flattening a complex body into one number, it can manufacture a false signal: labeling a healthy athlete as a medical concern, or clearing a person with dangerous visceral fat. The output looks precise, down to a single decimal place, which makes the underlying loss of information easy to forget. Precision and accuracy are not the same thing, and BMI has plenty of the former and very little of the latter for any one individual.
The Formula, Worked Out in Both Units
The math behind BMI is worth seeing once, because it makes the formula's blind spot impossible to miss. In metric units, you divide your weight in kilograms by your height in meters squared. Someone who is 1.75 meters tall and weighs 72 kilograms has a BMI of 72 divided by (1.75 times 1.75), which is 72 / 3.06, or about 23.5. That sits comfortably in the normal range.
In US units the arithmetic looks different but lands in the same place. Multiply your weight in pounds by 703, then divide by your height in inches squared. A person who is 69 inches tall and weighs 159 pounds works out to (159 times 703) / (69 times 69), which is 111,777 / 4,761, or about 23.5 again. Same body, same result, two unit systems.
Now look at what never appears anywhere in either calculation. There is no measurement of your waist, no skinfold, no muscle mass, no fat distribution, nothing about your age or your sex. The formula has exactly two inputs: height and weight. Everything else about your body, all the parts that actually decide your health, is invisible to it. That isn't a mistake in how people use BMI. It's baked into the equation, and no amount of careful interpretation can pull out information the formula never collected.
This is also why BMI is so tempting to over-trust. A number you can produce in two seconds feels authoritative, almost scientific. The BMI calculator does this arithmetic for you instantly, but that very speed is what hides how little the result actually knows about you.
Where BMI Is Genuinely Useful
Dismissing BMI entirely is its own mistake. The metric earns its place in three real situations.
First, scale. A public health researcher studying ten million people cannot run a DEXA scan on each one. BMI needs only a scale and a tape measure, and across a large group the individual errors wash out. Populations with higher average BMI reliably show higher rates of type 2 diabetes, heart disease, and several cancers. That signal is real and well documented.
Second, tracking yourself over time. If your height is fixed and your muscle mass is roughly stable, a rising BMI over months usually means rising fat. The metric is far more trustworthy as a personal trend line than as a one-time snapshot.
Third, the extremes. BMI is at its sharpest below 17 and above 35. At those edges, the chance that muscle is fooling the formula drops sharply, and the number tracks real risk closely. The danger zone for misreading is the crowded middle, roughly 25 to 30, where most people actually fall and where individual variation is widest.
This is also why BMI is everywhere in institutional settings. Insurers use it for underwriting, clinical studies use it to compare large groups, and some surgical and fertility programs use BMI thresholds for eligibility. In each case the appeal is the same: it's cheap, fast, and consistent across millions of records. None of that makes it a good measure of you as an individual. It makes it a convenient measure for systems that need to process people at scale. Knowing the difference helps you understand why a number with so many known flaws remains so deeply embedded in medicine.
BMI Across Different Life Stages
The standard adult categories quietly assume a healthy adult somewhere between about 20 and 65. Step outside that group and the same number can mean something completely different.
Children and teenagers
For anyone under 20, the adult cutoffs don't apply at all. Children are still growing, and body composition changes constantly with age and sex. Pediatricians use BMI-for-age percentiles instead, comparing a child against others of the same age and sex rather than against a fixed number. A teenager in the 60th percentile is read in a totally different way from an adult with the equivalent raw score. Dropping a child's height and weight into an adult BMI chart produces a number that means nothing.
Pregnancy
BMI is not valid during pregnancy. Weight gain is expected and healthy, and the formula has no way to separate it from fat gain. Clinicians instead track weight gain against a person's pre-pregnancy BMI using separate guidelines. A standard BMI calculation during pregnancy is simply the wrong tool.
Older adults
After about 65, two things shift at once. Muscle mass naturally declines, so a "normal" BMI can sit on top of low muscle and surprisingly high fat. And a slightly higher BMI is sometimes linked to better outcomes during illness and recovery, because a small reserve helps the body cope. For older adults, the very bottom of the "normal" range is not automatically the healthiest place to be.
Very tall and very short people
Because the formula squares height, it reads slightly high for very tall people and slightly low for very short people. The distortion is modest, but it's real, and it's one more reason a borderline number deserves a second look rather than a snap judgment.
The thread tying all four cases together is the same one running through this whole article. BMI was built around one specific kind of body, and the further you sit from that template, the more the number needs a second opinion.
The Three Ways BMI Misreads a Single Person
Almost every BMI error falls into one of three buckets. Knowing which bucket you're in tells you whether to trust your score or set it aside.
1. The muscle problem
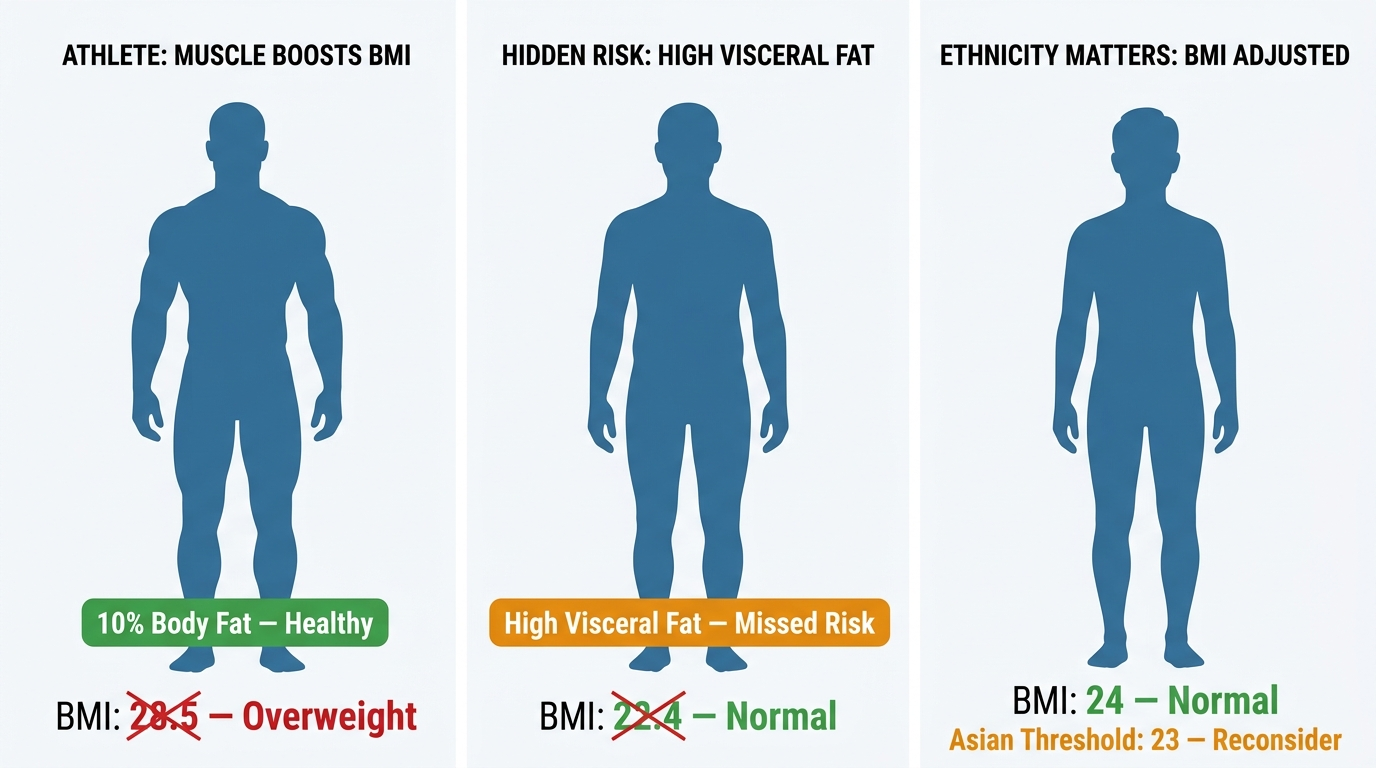
Muscle is denser than fat, so it weighs more for the same volume. A 5'11" recreational lifter at 210 pounds posts a BMI of 29.3, deep in "overweight," while carrying 12% body fat. The formula has no way to know that the weight is muscle. Anyone who trains seriously with weights, cycles competitively, or plays a power sport will tend to read high. For them BMI is close to meaningless. A body fat percentage estimate from the body fat calculator tells a far more honest story.
2. The hidden-fat problem
The reverse error is the dangerous one. A person can sit at a perfectly "normal" BMI of 22 while carrying a high percentage of visceral fat, the deep fat wrapped around the organs that drives metabolic disease. Researchers call this normal weight obesity, and it affects an estimated 20 to 30% of people with a normal BMI. A study in the European Heart Journal found that normal-weight people with high body fat carried roughly double the mortality risk of normal-weight people with normal body fat, despite identical BMI numbers.
3. The age, sex, and ancestry problem
The thresholds came largely from European men. They travel poorly. Older adults lose muscle and gain fat at the same weight, so a "fine" BMI can mask real risk after 65. Women naturally carry more fat than men at the same BMI. People of South and East Asian descent develop metabolic risk at lower numbers, which is why many health bodies use 23 as the overweight cutoff for this group rather than 25.
How to Read Your BMI Like a Clinician
A good clinician never treats BMI as a verdict. They treat it as the first question in a longer conversation. You can do the same with three free measurements and a simple rule for when to trust the number.
| Your situation | How much to trust BMI |
|---|---|
| You rarely strength train and are 18 to 60 | Reasonably reliable as a starting point |
| You lift weights or play a power sport | Low. Measure body fat instead |
| You're over 65 | Pair with waist size, muscle matters |
| Normal BMI but a soft middle | Check waist-to-height, watch for hidden fat |
The single best companion to BMI is your waist. Visceral fat is the metabolically active kind, and a tape measure around your midsection captures it better than weight ever will. Risk climbs above 35 inches for women and 40 inches for men, or more simply, keep your waist under half your height. The waist-to-hip ratio calculator turns those measurements into a risk read in seconds, and the ideal weight calculator gives you a target range that accounts for frame rather than a single magic number.
The waist-to-height check is worth doing because it's almost as fast as BMI and far more revealing. Take someone 70 inches tall with a 38-inch waist. Their waist-to-height ratio is 38 divided by 70, or 0.54, which is above the 0.5 threshold and flags elevated risk, even if their BMI happens to read "normal." The same person trimming to a 33-inch waist would drop to 0.47 and move into the safer zone. That single ratio caught a risk that BMI, looking only at total weight, would have missed entirely. It costs you one measurement with a tape you already own.
So here is the practical takeaway for your own number. Calculate your BMI, but never stop there. Add your waist measurement, work out your waist-to-height ratio, and if you have access to it, get a body fat estimate. If all three agree, you have a clear and trustworthy picture. If they disagree, the BMI is the one to distrust, because it's the only one of the three that can't see inside your body. The goal was never to score well on a 200-year-old formula. It's to understand what your body is actually doing.
Why a calculator beats a static chart here
A BMI chart on a government website hands you a category and walks away. It has no idea whether you're the rower or the office worker from our table. This is where Calculatry works differently. Every calculator on the site has a built-in AI assistant, so after it returns your BMI you can actually interrogate the result. Type something like "I'm 5'10", 188 pounds, I row five times a week, what does my BMI really mean?" and the assistant factors in the muscle context that the raw formula ignores, then points you to body fat and waist measurements as the next step.
The value shows up most for the people BMI fails. A 68-year-old can ask whether their "normal" reading might be hiding muscle loss. A woman of South Asian descent can ask whether the standard 25 cutoff even applies to her, or whether 23 is the more honest line. A parent can ask why their teenager's adult-style BMI looks alarming when the pediatrician wasn't worried. Each of those is a real question a printed chart simply cannot answer, because the chart doesn't know who's reading it. An assistant that takes your context and explains what your specific number means turns a generic category into something close to personal guidance, which is exactly what a raw BMI has never been able to provide.
That back-and-forth is the part no static health page offers, and it's the difference between a number and an answer. BMI is most useful at the extremes and least useful in the middle, exactly where most people live. Treat your score as the opening line. Your waist, your body fat, and your blood work are where the real story gets told.

Frequently Asked Questions
What does BMI stand for and what does it measure?
BMI stands for Body Mass Index. It is calculated by dividing your weight in kilograms by the square of your height in meters. The result places you in one of four categories: underweight (below 18.5), normal weight (18.5 to 24.9), overweight (25 to 29.9), or obese (30 and above). BMI measures a height-to-weight ratio only — it does not measure body fat directly.
Is BMI an accurate measure of health?
BMI is a useful screening tool at the population level but unreliable for individual health assessment. It cannot distinguish between muscle and fat mass, misclassifies many muscular people as overweight, and misses normal-weight individuals who carry dangerously high body fat — a condition called normal weight obesity affecting an estimated 20 to 30% of people with normal BMI scores.
What is a healthy BMI for adults?
The standard healthy BMI range for adults is 18.5 to 24.9. However, this range was developed primarily from European population data and may not apply equally across all ages, sexes, and ethnic backgrounds. For adults of Asian descent, many health organizations recommend an overweight threshold of 23 rather than 25.
Why does BMI classify muscular athletes as overweight?
BMI cannot distinguish between fat mass and muscle mass. Because muscle is denser and heavier than fat, muscular individuals often have a high body weight relative to their height, producing a BMI in the overweight or obese range despite very low body fat. This is one of the core limitations of the BMI formula when applied to individuals.
What should I track instead of or alongside BMI?
Better health indicators include body fat percentage (measured by DEXA scan, bioelectrical impedance, or skinfold calipers), waist circumference (risk increases above 35 inches for women and 40 inches for men), waist-to-height ratio (target below 0.5), and blood markers such as fasting glucose, triglycerides, and HDL cholesterol.