
BMI vs Body Fat Percentage: Which One Is Actually a Better Health Measure?
A 2004 UPenn study found that BMI misclassified 39% of women as healthy when they actually had dangerously high body fat. Here's what BMI gets wrong — and what to measure instead.
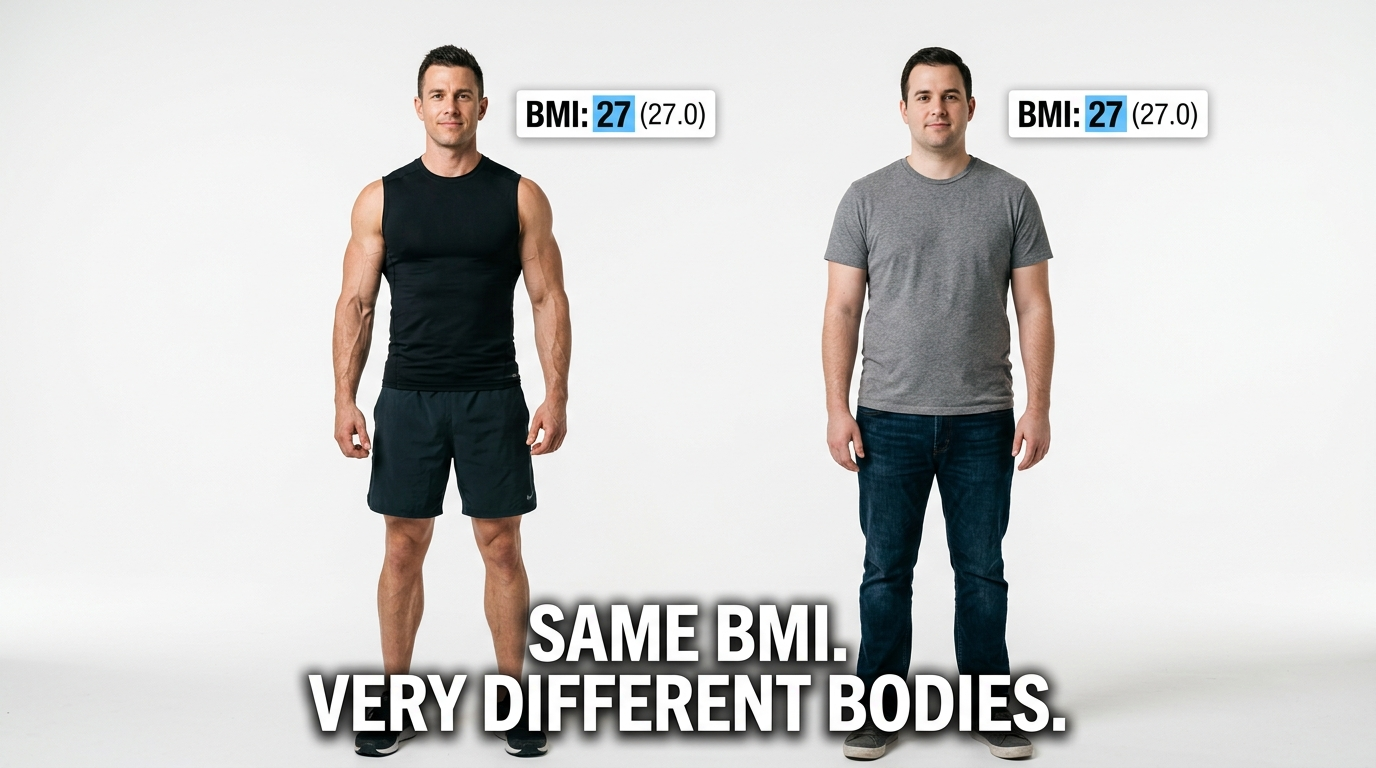
Here's a question almost no health article answers directly: if your BMI and your body fat percentage disagree about you, which one should you actually believe? One says you're overweight. The other says you're fit. They cannot both be right about your health, and the gap between them is where most people make the wrong call about their own body. This is the honest comparison, with the numbers laid out so you can see exactly when each measure earns your trust.
BMI and body fat percentage are not two versions of the same measurement. They answer different questions. BMI asks how heavy you are for your height. Body fat percentage asks how much of you is actually fat. Confusing the two is the most common mistake people make when they try to read their own health, so let's separate them cleanly.
The One-Sentence Difference
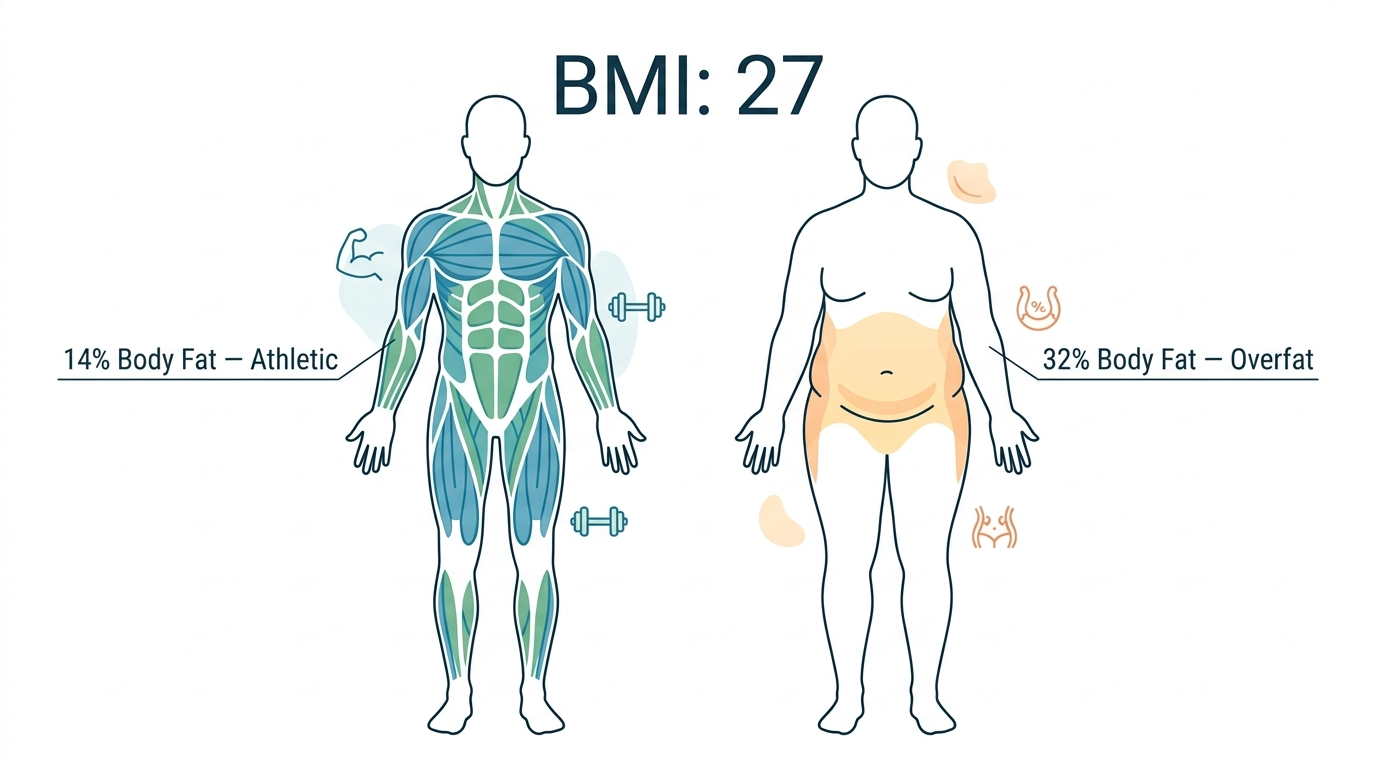
BMI is a ratio of weight to height. Body fat percentage is the share of your total weight made of fat tissue. That distinction sounds small. It changes everything, because two bodies of identical weight can hold wildly different amounts of muscle and fat.
A formula that only sees weight cannot tell muscle and fat apart. Body fat percentage measures the exact thing BMI can only guess at. That's why doctors increasingly treat body fat percentage as the more meaningful personal number, while keeping BMI as a fast first screen. Both have a place. The skill is knowing which one to act on.
It helps to understand why both numbers exist at all. BMI won because it's cheap and instant: two measurements anyone can take, no equipment, no expertise. That made it perfect for screening huge populations, which is exactly the job it was built for in the first place. Body fat percentage answers the question people actually care about, how much of me is fat, but it costs more to measure and the convenient methods carry more error. So we ended up with one number that's easy but crude and another that's meaningful but harder to pin down. Neither is going away, which is why knowing how to use each one is more useful than picking a side.
When BMI and Body Fat Disagree
Take a real example. A 5'9" man weighs 175 pounds. Run that through the formula and his BMI lands at 25.8, which the charts label "overweight." Now measure his body fat: 19%. For a man, 19% sits squarely in the fit-to-acceptable range. Same person, same morning, two numbers pointing in opposite directions.
Which one is telling the truth about his health? The body fat reading. The "overweight" BMI is being inflated by muscle the formula cannot see. If he dieted to satisfy the BMI chart, he'd strip away the very muscle keeping him healthy. You can reproduce this contradiction yourself by checking your number on the BMI calculator and then estimating your composition with the body fat percentage calculator. When they conflict, the body fat number almost always reflects reality more accurately.
The contradiction runs the other way too, and that version is more dangerous. Take a 5'4" woman who weighs 125 pounds. Her BMI is 21.5, dead center in the "normal" range, the kind of number that ends the conversation at most checkups. But suppose a scan puts her body fat at 33%, with little muscle and a soft midsection. By body fat, she's in the elevated-risk zone despite a textbook BMI. Nothing about her weight raised a flag, which is exactly why this case slips through. The lean-looking person with hidden fat gets a clean BMI and a false sense of safety, while the muscular person gets an unfair warning. Both are the same underlying failure: a formula judging health by weight alone.
How Each Number Is Actually Measured
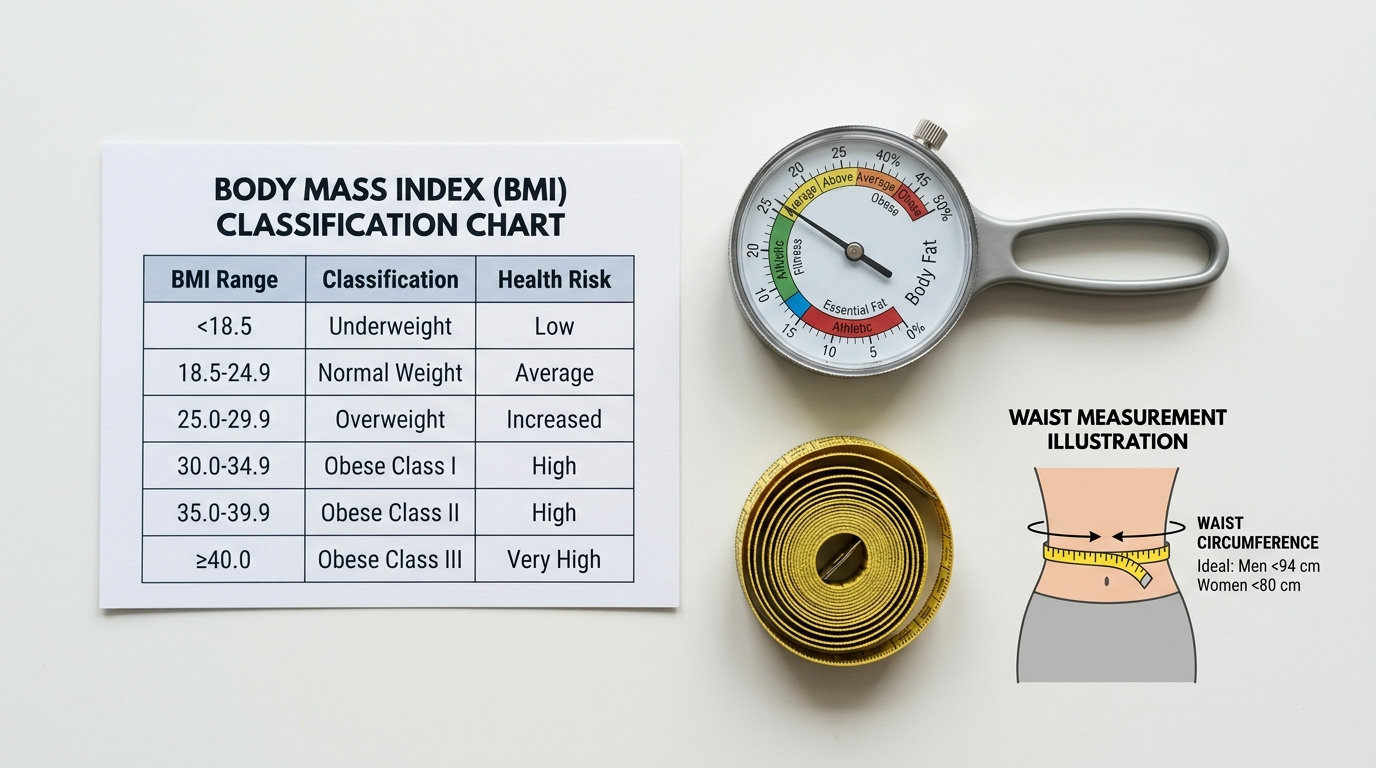
The two measures also differ enormously in how you get them. BMI needs a scale and a height. Body fat percentage can be estimated several ways, each trading accuracy for convenience and cost. Here's the honest comparison of the common methods.
| Method | Typical error | Cost | Reality check |
|---|---|---|---|
| DEXA scan | ±1 to 2% | $50 to $150 | Gold standard, needs a clinic visit |
| Skinfold calipers | ±3 to 5% | $10 to $30 | Cheap, but accuracy depends on the tester |
| Navy tape method | ±3 to 4% | Free | Just a tape measure and a formula |
| Smart scale (BIA) | ±3 to 8% | $30 to $80 | Swings with hydration; best for tracking trends |
| BMI (as a fat proxy) | No direct measure | Free | Infers fat from weight; blind to muscle |
The free options are genuinely useful. The Navy tape method, which the military itself relies on, needs only a tape measure around your neck and waist. The tape-measure body fat calculator runs that exact formula for you and lands within a few points of a clinic scan for most people.
One thing worth understanding about all the methods: they're estimating the same underlying reality through different proxies, which is why their numbers don't always agree. A DEXA scan measures the actual tissue with X-ray. A tape method infers fat from the shape of your body. A bioelectrical scale sends a tiny current and estimates fat from how that current travels through tissue with different water content. Each is a model of your body, not a direct readout. The practical lesson is to pick one method and stay with it. The exact number matters less than measuring the same way each time so your trend is honest, because a three-point shift you see consistently on one device is real progress even if a different device would put the absolute number somewhere else.
What Body Fat Percentage Reveals That BMI Can't
The headline advantage of body fat percentage is obvious: it measures fat directly instead of guessing from weight. But the deeper advantage is what it lets you understand about where your fat sits and what kind it is, two things that matter enormously for health and that BMI cannot touch.
Not all body fat is equal. Subcutaneous fat sits just under the skin, the kind you can pinch. Visceral fat sits deeper, wrapped around your organs, and it's the metabolically dangerous kind, strongly linked to heart disease, type 2 diabetes, and stroke. Two people can carry the same total body fat percentage with very different amounts of visceral fat, which is why body composition combined with a waist measurement tells you more than either number alone.
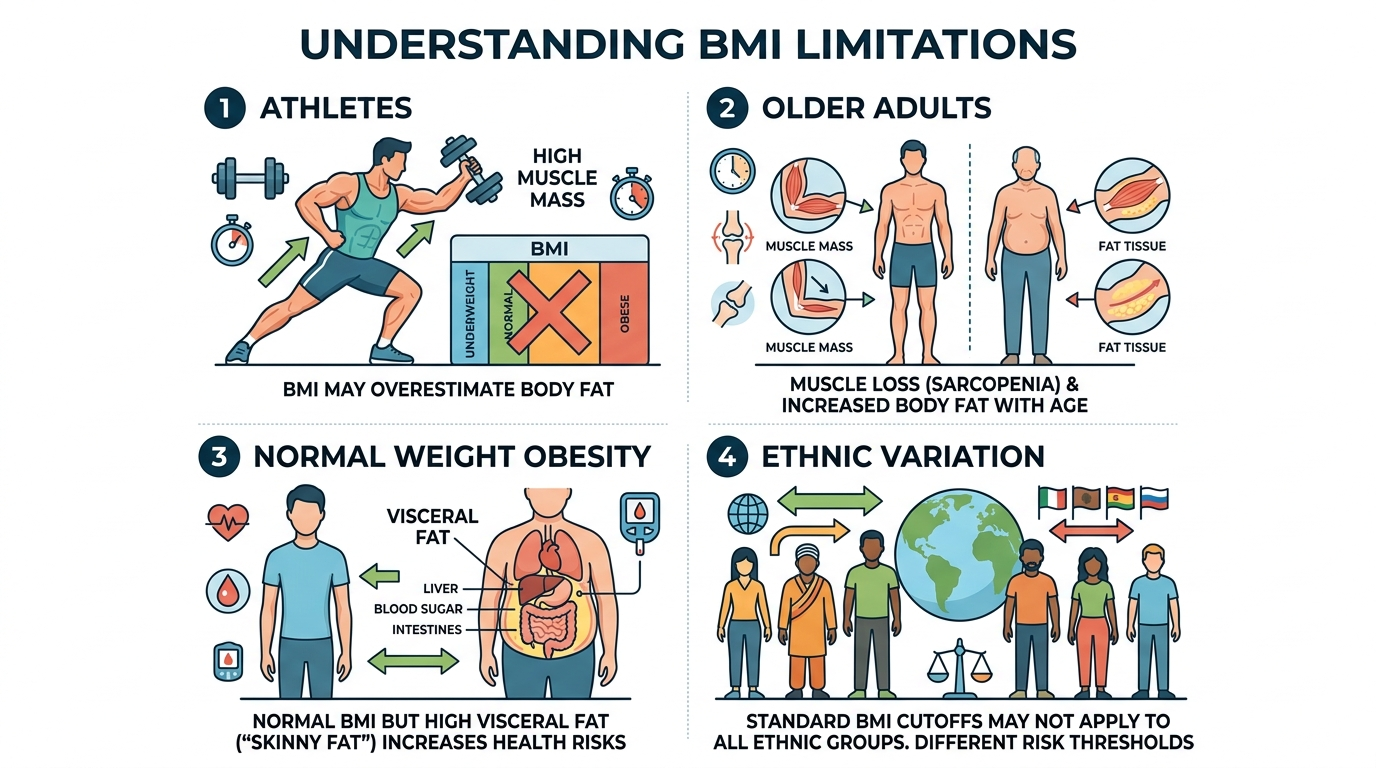
This is also where the "skinny fat" phenomenon comes from. Someone can look slim, weigh little, and post a flattering BMI while carrying a high proportion of visceral fat and very little muscle. BMI calls them healthy. Their body fat percentage and waist tell the truth. The reverse case, the muscular person flagged as overweight, gets all the attention, but the hidden-fat case is the more dangerous error precisely because nothing on the surface warns you.
Body fat percentage also tracks muscle by implication. If your weight holds steady but your body fat percentage falls, you've gained muscle and lost fat at the same time, a recomposition that the scale and BMI would both report as "no change." That's the kind of progress people give up on chasing because the bathroom scale lied to them. The fat percentage is the number that would have kept them going.
Which One Should You Act On?
The decision is simpler than the debate suggests. Use BMI as a thirty-second screen. Use body fat percentage as the number you actually steer by, especially in the cases where BMI is known to mislead.
The reason to keep BMI at all is speed and zero cost. You can compute it anywhere, instantly, with no equipment, which makes it a perfectly good first filter. If your BMI sits well inside the normal range, you train, and your waist is slim, you almost certainly don't need to rush out for a DEXA scan. BMI did its job: it told you there's probably no fire. The moment BMI lands in the murky 25 to 30 zone, or clashes with what the mirror and the tape measure say, that's your cue to bring in the more accurate measure. Think of it as escalation. Cheap screen first, precise measure only when the screen raises a question.
- You lift weights or play sport: trust body fat percentage. BMI will read you as heavier than your health warrants.
- You have a "normal" BMI but a soft midsection: trust body fat percentage and waist size. This is where BMI quietly misses real risk.
- You're tracking change over months: either works, but body fat percentage shows whether you're losing fat or muscle, which the scale alone never reveals.
- You only have thirty seconds and no tape measure: BMI is a fine starting flag, as long as you treat it as a question, not a verdict.
Pairing body fat with a waist measurement closes most of the remaining gap, because waist size captures the deep visceral fat that drives metabolic risk. The waist-to-hip ratio calculator adds that risk dimension in seconds.
There's a simple way to think about the hierarchy. BMI is the smoke alarm: cheap, everywhere, and worth listening to when it goes off, but prone to false alarms from burnt toast. Body fat percentage is walking into the room to see whether there's an actual fire. Waist measurement tells you how close the fire is to anything important. You wouldn't ignore a smoke alarm, but you also wouldn't evacuate the building without looking. Use BMI to decide whether to look closer, then let the better measures tell you what's really happening. For most people, that means BMI once in a while, body fat percentage tracked over time, and a waist check whenever the other two disagree.
How to Track Both Over Time
A single reading of either number is a snapshot. The real value comes from tracking, because trends are far more honest than any one measurement. The trick is consistency: measure the same way, at the same time, under the same conditions, so the changes you see are real and not noise.
For BMI, that's easy, since weight and height are stable inputs. Weigh yourself first thing in the morning, after using the bathroom and before eating, on the same scale. For body fat percentage, consistency matters even more because the home methods are sensitive to conditions. A bioelectrical impedance scale reads differently depending on hydration, so a reading after a salty meal or a workout can swing several points. Pick one time and one set of conditions and stick to them.
Watch the direction, not the daily wobble. Body weight can swing two to four pounds day to day from water and food alone, which is why a single scary morning means nothing. A weekly average compared month to month tells the true story. The same applies to body fat: don't react to one reading, watch the four-week trend. When BMI holds steady but body fat trends down, you're recomposing, and that's a win the scale will never show you.
Two free trackers make the numbers more honest. Progress photos taken in the same light and pose every two weeks often reveal change the scale hides, and a tape measure at the waist gives you a hard number that moves as fat leaves the midsection. Used alongside BMI and body fat percentage, they catch exactly the recomposition that weight alone misses. None of this costs anything beyond a phone and a tape, and together they turn four imperfect signals into one reliable trend.
Common Mistakes People Make With Both Numbers
A few predictable errors trip people up when they start measuring. Avoiding them saves a lot of confusion and a lot of misplaced worry.
- Treating one BMI reading as a diagnosis. It's a screen, not a verdict. A borderline number is a prompt to measure more, not a reason to panic or diet hard.
- Trusting a smart scale's body fat number to the decimal. Home devices have a real margin of error. Use them for the trend, not the exact figure.
- Chasing a single-digit body fat percentage for health reasons. Very low body fat harms hormones and immunity. Lean is good; extreme is not.
- Ignoring the waist entirely. Waist size captures visceral fat that both BMI and a body fat percentage can partly miss. It's the cheapest high-value measurement you can take.
- Measuring inconsistently and then trusting the comparison. A reading after a workout versus one after a rest day are not comparable. Standardize or the trend is meaningless.
None of these mistakes are about laziness. They come from treating these numbers as more precise and more meaningful in isolation than they actually are. Read together, tracked consistently, and paired with a waist measurement, they give you a genuinely useful picture. Read alone and over-trusted, any one of them can mislead you.
How to Get Both Numbers Right
The smartest approach uses both measures together, with each doing the job it's good at. BMI flags the question fast. Body fat percentage and waist size answer it accurately. Read in combination, they rarely lead you wrong.
This is where a static chart falls short and an interactive tool pulls ahead. After the Calculatry calculators return your numbers, the built-in AI assistant on the page can interpret them together. Tell it "my BMI is 25.8 but my body fat is 19% and I lift four times a week," and it explains why the two disagree and which one to act on, instead of leaving you to reconcile two conflicting labels alone. That interpretation step is the part a printed BMI table can never provide, and it's exactly where most people get stuck.
The assistant is most useful for the in-between cases, which is most people. Plenty of readers don't have a clean story like "obvious athlete" or "clearly sedentary." They're a 38-year-old who lifts twice a week, walks a lot, and has a BMI of 27 and a body fat estimate of 22%. Is that fine? Should they cut? A static chart can't weigh those competing signals. An assistant can take the full set, BMI, body fat, waist, activity, age, and give a reasoned read instead of a category. That's the difference between data and advice, and it's the part of health math that has always been missing from a printed reference table.
Run both numbers, add your waist, and read them as a set. If BMI says one thing and body fat says another, you already know which one is describing your actual body. Believe the measure that can see your muscle.
The bigger point underneath this whole comparison is worth holding onto. No single number captures your health, and the search for the one perfect metric is a distraction. BMI, body fat percentage, and waist size are each a different window into the same body, and the clearest picture comes from looking through all three at once. The mistake people make isn't choosing the wrong number; it's expecting any one number to carry the whole answer. Treat them as a small dashboard rather than a single verdict, and you'll read your own health far more accurately than the person anchoring everything to whichever figure they happened to hear first.
Frequently Asked Questions
Is BMI or body fat percentage more accurate?
Body fat percentage is more accurate. BMI uses only height and weight, so it misclassifies muscular individuals as overweight and can miss high body fat in people with low muscle mass — a condition called normal weight obesity. Body fat percentage directly measures what matters most for health.
What is a healthy body fat percentage?
For men: athletes 6–13%, fitness 14–17%, acceptable 18–24%, obese 25%+. For women: athletes 14–20%, fitness 21–24%, acceptable 25–31%, obese 32%+. These ranges vary slightly by age.
Can you have a normal BMI but high body fat?
Yes. This is called normal weight obesity or being "skinny fat." Studies show up to 30% of people with a normal BMI have body fat percentages in the obese range, putting them at elevated cardiovascular and metabolic risk despite appearing lean.
How do you measure body fat percentage at home?
The most accessible methods are skinfold calipers, bioelectrical impedance scales, or the Navy circumference formula. DEXA scans are the gold standard for accuracy but require a clinical setting. All home methods have a margin of error of 3–5%.
Why does BMI classify muscular athletes as overweight?
BMI cannot distinguish between fat mass and muscle mass. Since muscle is denser than fat, highly muscular people often have a BMI in the overweight or obese range despite very low body fat. This is one of the fundamental limitations of the BMI formula.